
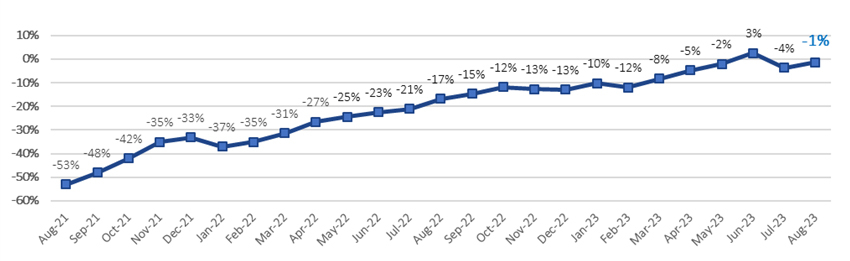
Total passenger traffic up 18.7% YoY reaching 99% of pre-pandemic levels
Armenia, Ecuador, Italy and Brazil above August 2019 levels
Aircraft movements at 99% of August 2019
LUXEMBOURG–(BUSINESS WIRE)–Corporación América Airports S.A. (NYSE: CAAP), (“CAAP” or the “Company”), one of the leading private airport operators in the world, reported today a 18.7% year-on-year (YoY) increase in passenger traffic in August 2023, reaching 98.7% of August 2019 levels.
Passenger Traffic, Cargo Volume and Aircraft Movements Highlights (2023 vs. 2022)
Statistics
Aug’23
Aug’22
% Var.
YTD’23
YTD’22
% Var.
Domestic Passengers (thousands)
4,108
3,451
19.0%
30,012
24,239
23.8%
International Passengers (thousands)
2,787
2,233
24.8%
18,661
13,167
41.7%
Transit Passengers (thousands)
596
629
-5.3%
4,713
3,765
25.2%
Total Passengers (thousands)
7,491
6,313
18.7%
53,385
41,172
29.7%
Cargo Volume (thousand tons)
31.0
26.8
15.4%
237.7
221.7
7.2%
Total Aircraft Movements (thousands)
77.0
69.3
11.0%
568.0
472.6
20.2%
Passenger Traffic, Cargo Volume and Aircraft Movements Highlights (2023 vs. 2019)
Statistics
Aug’23
Aug’19
% Var.
YTD’23
YTD’19(1)(2)
% Var.
Domestic Passengers (thousands)
4,108
4,265
-3.7%
30,012
31,484
-4.7%
International Passengers (thousands)
2,787
2,683
3.9%
18,661
19,100
-2.3%
Transit Passengers (thousands)
596
644
-7.5%
4,713
5,546
-15.0%
Total Passengers (thousands)
7,491
7,592
-1.3%
53,385
56,130
-4.9%
Cargo Volume (thousand tons)
31.0
32.4
-4.5%
237.7
278.3
-14.6%
Total Aircraft Movements (thousands)
77.0
77.1
-0.1%
568.0
574.3
-1.1%
(1)
Note that preliminary passenger traffic figures for 2019, as well as January 2020 for Ezeiza Airport, in Argentina, were adjusted to include additional inbound passengers not accounted for in the initial count, for an average of approximately 5% of total passenger traffic at Ezeiza Airport and 1% of total traffic at CAAP, during that period. Importantly, inbound traffic does not affect revenues, as tariffs are applicable on departure passengers.
(2)
Cargo volumes in Uruguay were rectified from January 2019 to June 2020, to reflect all cargo passing through the cargo terminal, instead of air cargo only.
Passenger Traffic Overview
Total passenger traffic grew 18.7% compared to the same month of 2022, supported by the ongoing recovery in travel demand after the Covid-19 pandemic and the gradual resumption of routes and frequencies across all countries of operations. Overall passenger traffic reached 98.7% of August 2019 levels, up from 96.3% posted in July, with international passenger traffic surpassing pre-pandemic levels of August 2019 by 3.9%. Domestic traffic stood at 96.3% of August 2019, up from 93.6% in July.
In Argentina, total passenger traffic continued to recover in August, increasing 23.8% year-over-year (YoY) and reaching 98.4% of pre-pandemic volumes, a slight improvement from 98.1% in July. Domestic traffic had declined compared to May and June when it benefited from a government program aimed at boosting domestic tourism. However, domestic traffic increased on an absolute basis month-over-month and was 2.9% higher than August 2019 levels. International passenger traffic also continued to recover, reaching 87.0% of pre-pandemic levels, a slight decrease from the 88.3% recorded in July.
In Italy, passenger traffic benefited from the summer season and grew by 16.8% compared to the same month in 2022 and surpassed pre-pandemic levels for the second consecutive month, increasing by 4.1% compared to August 2019. International passenger traffic, which accounted for 80% of the total traffic, exceeded August 2019 levels by 1.6%, while domestic passenger traffic surpassed pre-pandemic levels by 16.4%. Although some pre-pandemic destinations still need to resume at Pisa airport, Florence airport has already exceeded 2019 levels and was 19.8% above August 2019 traffic volumes.
In Brazil, total passenger traffic increased by 3.8% YoY and surpassed pre-pandemic levels for the first time, rising by 1.4% compared to August 2019. Domestic traffic, which accounted for two-thirds of the total traffic, exceeded pre-pandemic levels by 7.8%, while transit passengers improved to 88.9% of August 2019 levels, up from 77.6% in July.
In Uruguay, total passenger traffic, which is largely international, continued to recover and increased 35.1% YoY, reaching 91.3% of August 2019 levels, a slight decline from 94.6% recorded in July.
In Ecuador, passenger traffic increased 5.2% YoY and surpassed pre-pandemic volumes by 6.5%. Both domestic and international passenger traffic exceeded pre-pandemic levels by 12.0% and 2.0%, respectively.
In Armenia, passenger traffic continued its solid recovery trend, increasing by 41.9% YoY and surpassing the pre-pandemic levels of August 2019 by 62.0%. This is consistent with the 61.5% growth recorded in July but a decline from the 82.4% growth observed in June. The drop in the comparison against the same month of 2019, as compared to June, is explained by the fact that July and August are traditionally strong months in terms of passenger traffic, and the Armenia airport is operating at its maximum capacity due to the significant growth it has experienced. This makes the comparison between August 2023 and August 2019 appear less favorable than the comparison between June 2023 and June 2019. In August 2019, the volume increased due to the high seasonality of the month, whereas in August 2023, although traffic also increased due to high seasonality, the growth was limited by the current capacity of the airport.
Cargo Volume and Aircraft Movements
Cargo volume increased 15.4% YoY and improved to 95.5% of August 2019 levels, or 97.1% when adjusting for the discontinuation of operations in Peru. Cargo volumes in Armenia and Uruguay were above pre-pandemic levels, whereas Italy stood at 90.8%, Ecuador at 99.2%, Argentina at 92.6% and Brazil at 86.1%. Almost 70% of cargo volume originated in Argentina, Ecuador and Uruguay.
Aircraft movements increased 11.0% YoY to 99.9% of August 2019 levels, or exceeded pre-pandemic levels by 3.7% when adjusting for the discontinuation of operations in Peru. All the countries of operations, except Ecuador, exceeded August 2019 pre-pandemic levels.
Summary Passenger Traffic, Cargo Volume and Aircraft Movements (2023 vs. 2022)
Aug’23
Aug’22
% Var.
YTD’23
YTD’22
% Var.
Passenger Traffic (thousands)
Argentina(1)
3,815
3,080
23.8%
28,325
20,889
35.6%
Italy
939
804
16.8%
5,493
4,410
24.5%
Brazil
1,487
1,433
3.8%
11,392
10,024
13.6%
Uruguay
158
117
35.1%
1,253
880
42.4%
Ecuador
445
423
5.2%
3,276
2,740
19.6%
Armenia
647
456
41.9%
3,647
2,229
63.6%
TOTAL
7,491
6,313
18.7%
53,385
41,172
29.7%
(1)
See Footnote 1 in previous table. (2) See Footnote 2 in previous table.
Cargo Volume (tons)
Argentina
15,973
15,147
5.4%
122,487
119,660
2.4%
Italy
751
977
-23.1%
8,624
9,792
-11.9%
Brazil
5,878
3,559
65.1%
42,987
35,579
20.8%
Uruguay(2)
2,519
2,568
-1.9%
20,930
21,950
-4.6%
Ecuador
2,909
2,514
15.7%
21,740
22,695
-4.2%
Armenia
2,944
2,072
42.1%
20,948
11,995
74.6%
TOTAL
30,974
26,837
15.4%
237,716
221,672
7.2%
Aircraft Movements
Argentina
41,025
35,748
14.8%
304,943
243,240
25.4%
Italy
8,466
7,568
11.9%
52,487
46,192
13.6%
Brazil
13,630
12,754
6.9%
106,544
93,107
14.4%
Uruguay
2,264
1,959
15.6%
20,995
17,525
19.8%
Ecuador
6,852
7,172
-4.5%
53,107
51,121
3.9%
Armenia
4,721
4,123
14.5%
29,948
21,416
39.8%
TOTAL
76,958
69,324
11.0%
568,024
472,601
20.2%
Summary Passenger Traffic, Cargo Volume and Aircraft Movements (2023 vs. 2019)
Aug’23
Aug’19
% Var.
YTD’23
YTD’19
% Var.
Passenger Traffic (thousands)
Argentina(1)
3,815
3,875
-1.6%
28,325
29,151
-2.8%
Italy
939
902
4.1%
5,493
5,569
-1.4%
Brazil
1,487
1,467
1.4%
11,392
12,464
-8.6%
Uruguay
158
173
-8.7%
1,253
1,490
-15.9%
Ecuador
445
418
6.5%
3,276
3,053
7.3%
Armenia
647
400
62.0%
3,647
2,092
74.3%
Peru
358
–
–
2,311
–
TOTAL
7,491
7,592
-1.3%
53,385
56,130
-4.9%
(1)
See Footnote 1 in previous table. (2) See Footnote 2 in previous table.
Cargo Volume (tons)
Argentina
15,973
17,247
-7.4%
122,487
146,445
-16.4%
Italy
751
827
-9.2%
8,624
8,494
1.5%
Brazil
5,878
6,823
-13.9%
42,987
62,505
-31.2%
Uruguay(2)
2,519
2,280
10.5%
20,930
18,816
11.2%
Ecuador
2,909
2,933
-0.8%
21,740
27,044
-19.6%
Armenia
2,944
1,773
66.0%
20,948
11,606
80.5%
Peru
–
540
–
–
3,340
–
TOTAL
30,974
32,423
-4.5%
237,716
278,250
-14.6%
Aircraft Movements
Argentina
41,025
39,702
3.3%
304,943
301,737
1.1%
Italy
8,466
8,379
1.0%
52,487
53,583
-2.0%
Brazil
13,630
13,370
1.9%
106,544
106,054
0.5%
Uruguay
2,264
2,084
8.6%
20,995
20,071
4.6%
Ecuador
6,852
7,423
-7.7%
53,107
55,102
-3.6%
Armenia
4,721
3,221
46.6%
29,948
17,636
69.8%
Peru
–
2,894
–
–
20,165
–
TOTAL
76,958
77,073
-0.1%
568,024
574,348
-1.1%
About Corporación América Airports
Corporación América Airports acquires, develops and operates airport concessions. Currently, the Company operates 53 airports in 6 countries across Latin America and Europe (Argentina, Brazil, Uruguay, Ecuador, Armenia and Italy). In 2022, Corporación América Airports served 65.6 million passengers, 83.7% above the 35.7 million passengers served in 2021 and 22.1% below the 84.2 million served in 2019. The Company is listed on the New York Stock Exchange where it trades under the ticker “CAAP”. For more information, visit http://investors.corporacionamericaairports.com.
Contacts
Investor Relations Contact
Patricio Iñaki Esnaola
Email: patricio.esnaola@caairports.com
Phone: +5411 4899-6716


